Time and time again, I hear the frustration of our executive clients with the performance and speed of analytics and data departments.
After spending years designing and executing analytical interventions for clients, it’s apparent that the promise of artificial intelligence (AI) and advanced analytics revolutionizing how a business runs hasn’t materialized for many organizations.
The benefits of agile methodologies in modern application development have been leveraged for many years. So why have data and analytics teams not been so quick to adapt? Why has so much money been invested into data and analytics technology and premium hires only to achieve mixed results and an underwhelming business impact?
Specific technologies are not the problem. Instead, underperforming analytics teams often lack workable answers to these three questions:
- How do we redesign analytics workflows, whether for data science, data engineering, or decision support, into a genuinely agile system?
- What is a better way to model reality for analysis that supports agile best practices?
- How can we organize around a common purpose in a way that doesn’t hold back proper human performance, especially for analytics impact?
The first fundamental undertaking to establish an agile team process is to define the product surface area with full clarity and make it as simple as possible.
The product surface area is what is actually getting released. This can be as simple as a few reports or more complex scenarios packages containing portfolios of machine learning (ML) models, reports, self-service data models, catalog updates, glossary updates, and many other possible services.
Unlike traditional product teams that tend to focus on a single application and its supported components, data and advanced analytics teams usually have to manage a more significant footprint of technologies and services. Compounding the problem: Most analytics professionals and knowledge workers are not familiar with DevOps, MLOps, and agile methodologies.
Product choices are critical here. I would always lean more toward products that allow the surface area to be less fragmented. For example, I have seen companies implementing Snowflake, Databricks, Teradata, BigQuery, AWS Data Lake, Anaconda on VMs, Power BI, Tableau, and Looker—all in a complete fragmented mess of releases and dependencies that amplified inefficiencies across the board.
I call this a death by a thousand-points solution. Overlapping and redundant capabilities and the cost of so many vendors amount to a huge waste of money.
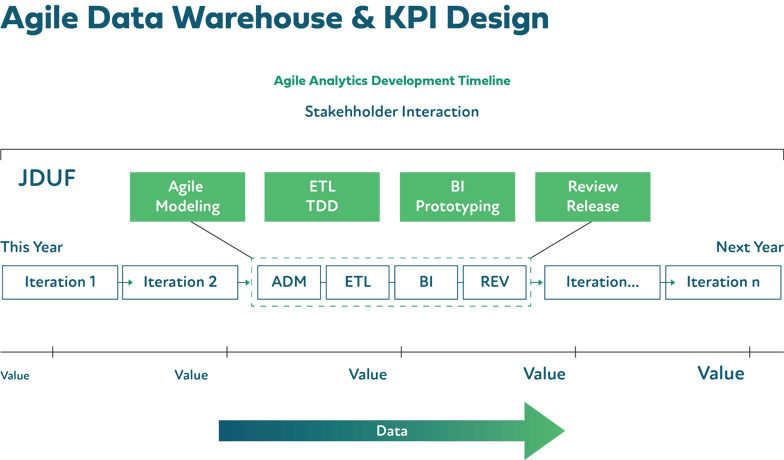
Release and spring planning must involve more stakeholder interaction, and large initiatives need to be broken down into smaller wins with monthly or bi-monthly sprints. Just enough design up front (JEDUF) needs to replace the waterfall mentality of trying to solve every need with giant releases.
“Epics” are called “analytics projects” and can be anything from creating a new modern analytics platform to reducing fraud transactions by 10%.
I replace “features’” with three distinct features types: objective, metrics, and value.
Metrics are how we know we have met the objectives or are making progress. The reduced 911 call time objective may have the metric of “response time is lower than the current 8.5 minutes.”
Value is simply the upside to the organization if the objectives are met. For the emergency response time reduction objective, the value would be “additional lives saved.” User stories (or requirements) and tasks are treated as usual and rolled up under one of the feature types.
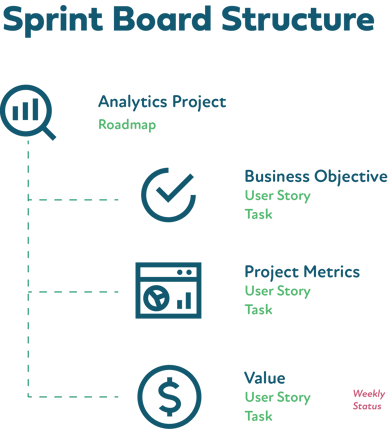
Additionally, I recommend monthly business impact reports (MBIR) be done for executives and stakeholders. This is usually informed by the Value branch of work and is how we prove the impact and ROI of the work to the organization—an aspect that is ignored far too often.
This simple way to run an analytics team board is exceptionally practical and has the benefit of bridging the technical with the business objectives.
The following foundational pillar is one of the most vital undertakings of any analytics workflow: the ability to model reality into valuable and flexible data structures.
A modeling design phase is part of every sprint that enables and eases subsequent work. This is often overlooked and even skipped in the pursuit of quick deliverables. This antipattern has the opposite effect as the more sound modeling is ignored and the more technical debt, inflexibility, and overall delivery time become debilitating.
Some clients ask me if they can just buy a product to solve for this. The answer is a resounding no. I listen to sales pitches from many point solutions that offer a quick path to avoid modeling with their “magic” AI product that will figure out the models for you. This is dangerous, and companies are often too willing to give up one of their most significant competitive advantages around data.
Here are two data modeling techniques that are effective regardless of how your raw data starts.
The first is known by almost every data professional and is easy to understand and very hard to master. The Kimbal Dimensional Modeling method has proven effective over decades of implementation in the wild, and typical star schemas and the practice of denormalizing for reporting and analytics is still important today. The problem is the way organizations plan and implement it is far from agile.
The second technique is newer and has gained traction in the last few years. It is more of a staging layer technique and can be used as an intermediate layer before implementing star schemas. Data Vault 2.0 is the formal name, and it does a good job of combining the best of Kimbal with normalized tables.
Some organizations will make the Data Vault model the actual end-state EDW layer model and let consumers interact from there. Data Vault is great for agile workflows and has many benefits that I don’t have time to dive into here. The most significant disadvantages are its newness and the lack of attestation in the industry.
The final topic of creating effective, agile analytics teams is the operating system of the team/s themselves. What do we call the framework used to run a whole company or teams within? I call it an “operating model,” the approach an organization takes to structure, plan, and process.
Even if my clients run their projects with effective agile principles, the organization itself does not run that way. While all companies run slightly differently, they effectively all use the same operating model invented over 120 years ago. For example, almost all companies use the same hierarchy that places managers under directors under executives, where decisions come down from the top and action lives at the bottom.
What's wrong with that standard structure? Why must we create detailed upfront plans before we start executing? Well, you wouldn’t want to start building a 30-floor skyscraper if your foundation was designed to only support 10. You want a concrete plan, and you want to deliver on that plan.
This attitude has become so entrenched that the entire ecosystem of consultancies and services grew up around it, enabling lower bids on projects and lots of profit on inevitable change orders. People want to maximize predictability and eliminate surprises. We like this so much that we tried to build software this way. Only software is a lot less predictable than construction. It’s more art than science, and it’s actually possible and beneficial to change your plans when you learn new information. That’s the basis of agility.
These parent-child employee relationships stifle the innovation, rapid adjustments, and adaptation that is so important. Predict-and-control mentality must make way for an adapt-and-learn culture.
I find it funny that a trendy book on culture, The Culture Code, by Daniel Coyle references Zappos as a study in thriving corporate culture and employee retention, writing:
“Zappos, which was sold to Amazon, now has fifteen hundred employees and $2 billion in revenue. It is consistently ranked among the country’s top employee-friendly companies and attracts hundreds of applications for each available opening. It is easier to get into Harvard than to get a job at Zappos.”
Unfortunately, the author doesn’t actually dig into why that is. Zappos was one of many companies that have adopted a meta-framework by which it could operate without traditional managers. Creating organizations or teams that operate with a new operating system is not easy. A shift to operate with a set of meta-framework rules that allow self-organization with limits is a significant shift in thinking that’s hard to stomach for most leaders.
Companies with traditional hierarchies can only change as fast as their leaders can handle it. Bringing on better leaders or simplifying the business will buy time, but they’ll still be outpaced by the rate of change. Seeing this limitation, responsive organizations aim to distribute authority and decision-making to all of their employees—even if it makes them less predictable and efficient in the short run. The goal is to increase their capacity to learn and respond to change by empowering more of them to do so. The organizational chart itself is merely the most extreme form of “Big Design Upfront.”
To sum up, here are the three significant gaps that I see with a client’s ability to deploy and manage effective analytics teams: ineffective agile processes and the technology architecture to support those processes; absence of effective modeling of reality; and forcing teams to work under antiquated management hierarchies hindering adapt-and-learn motions and employee engagement.
Redapt has helped hundreds of organizations execute on their advanced analytics strategies. We can help your organization too. Reach out for a free opportunity assessment.
Get Clarity Today.
Book a Clarity Call and Get Actionable Insights For Implementation Success.
- Discover make-or-break focus areas.
- Identify process gaps.
- Uncover the best tech solutions.